Converting QGIS layer to kmz
I have developed layer2kmz plug-in for QGIS that allows to convert a layer in QGIS to kmz format. The advantage of this plugin over other translations to kml format is that it conveys the symbology with the spatial data.
Recently I have updated the plug-in to work with QGIS v3.x. Many things changed in this from QGIS version on (e.g. Qt5, Pyhton3, among others) and the layer2kmz code had to be revised. To celebrate this first blog post and the >30000 downloads of the plug-in, I decided to move it from experimental do stable. You can download it with the plug-in manager in QGIS.
Advertisement
The motivation to develop this plug-in was mostly related to inform field work with spatial data. Many colleagues are using Google Earth and mobile GIS apps to guide their field work. It really helps to have previously collected data on interactive maps to either go to the same place to collect more related specimens or to avoid that already sampled place and provide a more widespread sampling of the area. Of course, most of the data we collect are locations/points with symbology often representing different species. This is useful information to have in the field, especially if you don’t have to navigate a data base or a spreadsheet to find it! However, the interest of a larger and more diverse community of QGIS’s users, broaden the focus of the plug-in to lines and polygons also.
The kml/kmz format is very useful for this purpose. It is a open standardized XML format with good reference available and optimized for geographic visualization. It allows to link simple and HTML formatted tables, images, hyperlinks and other features with each record for immediate visualization. The kml is the base document and the kmz is a zipped file of the kml. This not only allows to reduce size for transmission over internet but, more importantly in this context, it allows to pack information to be displayed with the record such as the symbol.
Advertisement
At this moment, layer2kmz is able to export different symbols from point data by rasterizing the symbol and including it in the kmz, as long as they are using single or categorized symbology. For lines, it exports line width and color, and polygons, exports stroke width and color, plus fill color.
This is the main graphical dialogue:
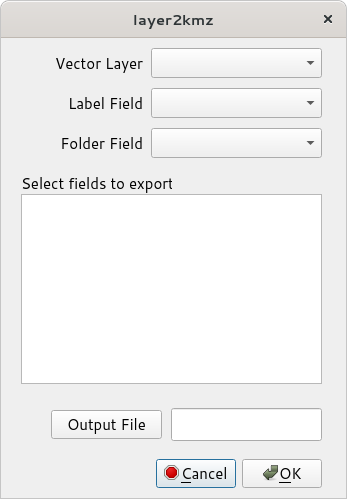
As you can see, it has several inputs. The “Vector Layer” is simply the layer to be converted. The dropdown lists all vector layers in the table of contents. The remaining inputs are listed from fields in the attribute table:
- Label Field: field to be used as a label next to each point in the kmz
- Folder Field: column providing names that group individual records in a folder (useful, for instance, if you have many samples and you need to turn on or off the display of many at the same time)
- Fields to Export: information in the attribute table that you would like to see in the kmz when selecting a point (you can select multiple fields with shift or control keys)
- Output file: browse to a destination to create a new kmz file.
It is fairly simple to use. You might have to tweak the size of points in line widths to display properly in your app or GEarth. Note that layer2kmz does not check the coordinate system. As so, it expects to have the same coordinate system as the maps you want to overlay the information with. If you plan to use with GEarth, it is typically geographical coordinates in the WGS84 system (EPSG:4326).
Advertisement
Future plans (depending on time available…):
- include an image with each record
- other style options (now only single or categorized styles)
- possibly allow multiple layers on same kmz…
If you have any suggestions, please send them!